Data Projects
Here are some fun data projects I have worked on.
01
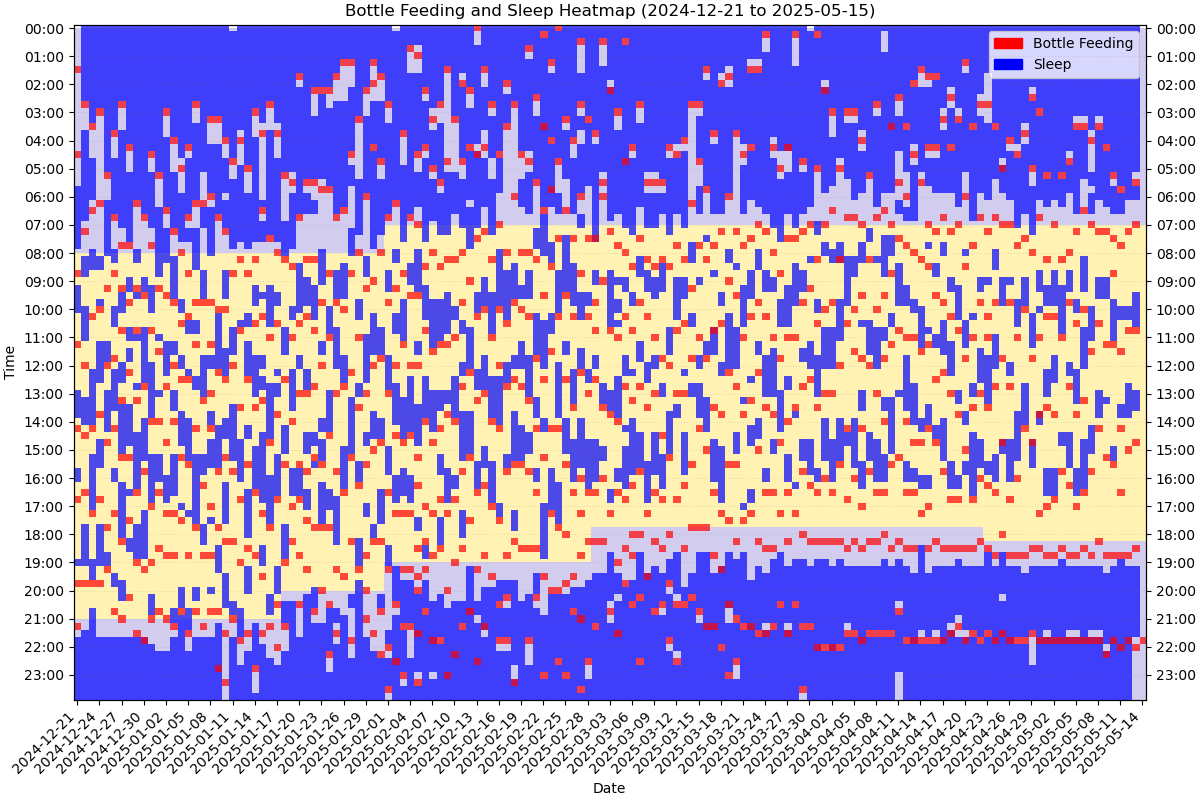
My Growing Baby
I completed a project tracking my child's eating and sleeping habits, revealing compelling insights. This experience deepened my understanding of his needs and promoted healthier family habits.

02
Nutrition Check
I started this cool project to track what I was eating and see what nutrients I might be missing. The results were pretty surprising and motivated me to add a power meal to my daily routine. It’s made a real difference in my nutrition and overall vibe!
03
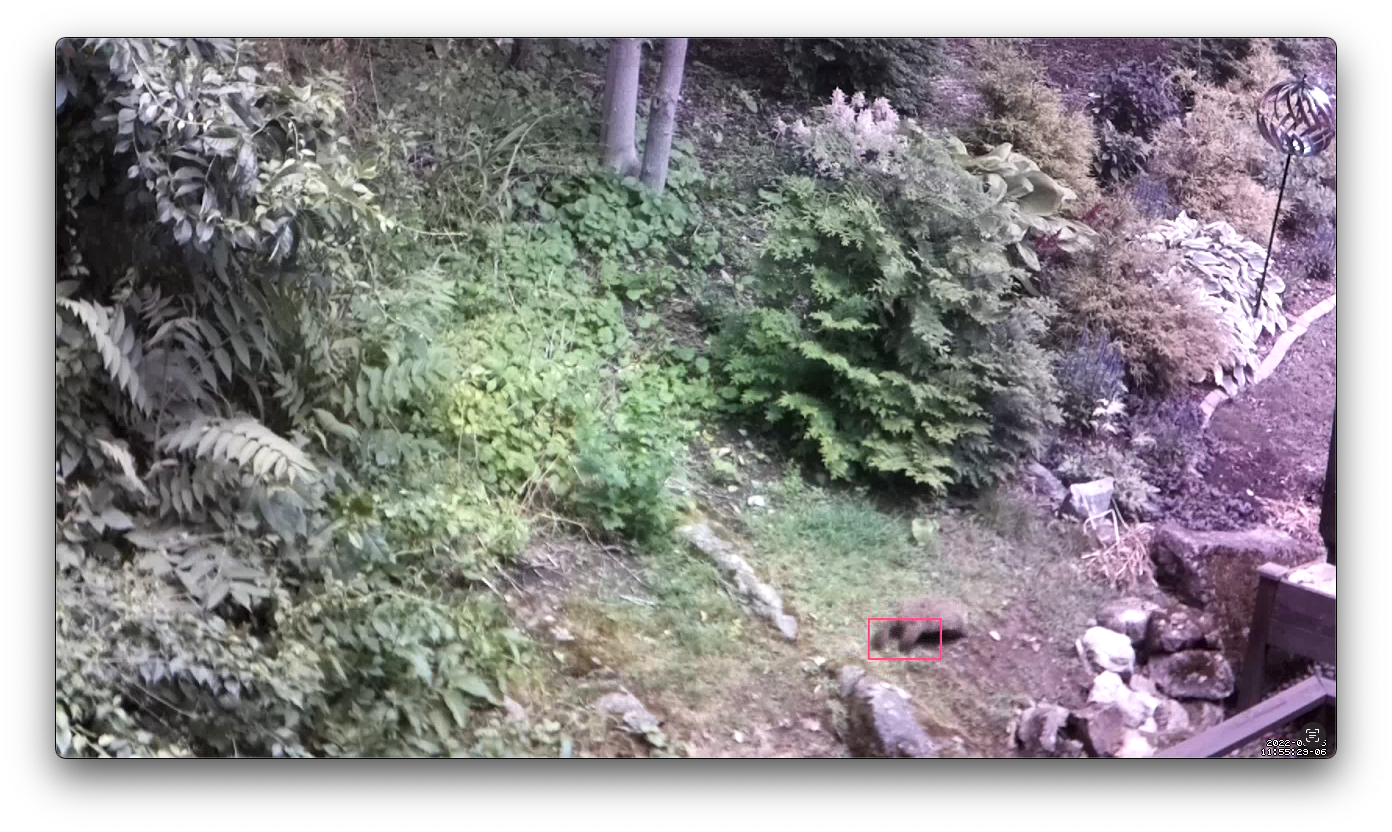
Groundhog Camera
In an exciting personal project, I set out to film the groundhogs on my property to observe their behavior. I built a Raspberry Pi camera and configured a home NAS to create a seamless monitoring system. By tuning the video capture to save only when motion is detected, I collected data, which I organized into training and signal files for a video detection machine learning. This endeavor not only deepened my understanding of the local wildlife but also honed my technical skills in data collection and analysis.
04
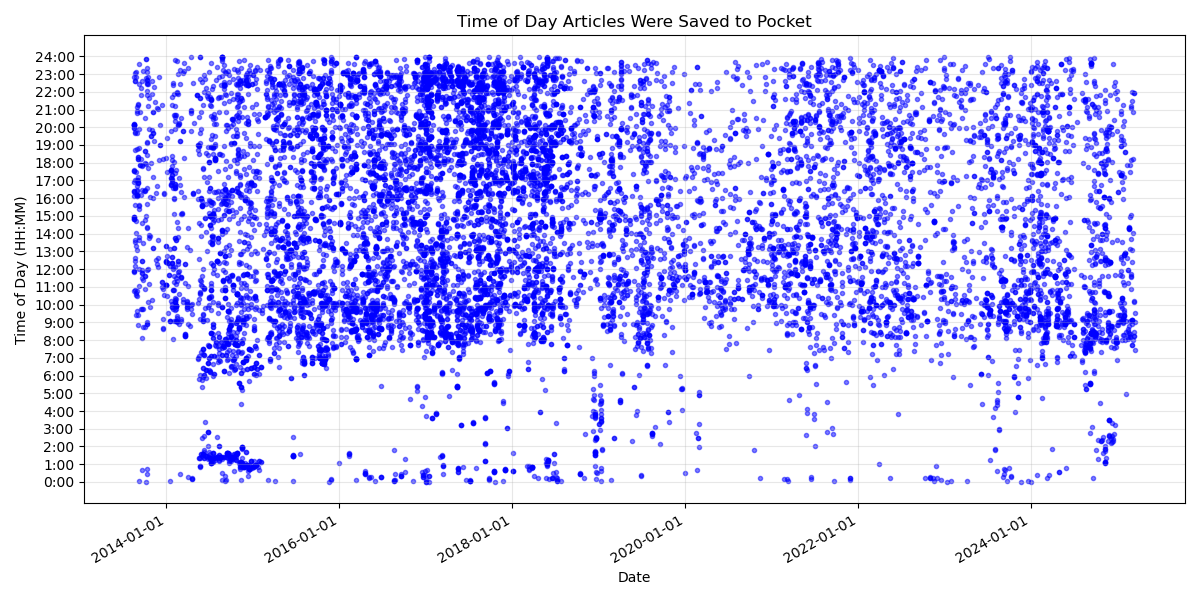
Articles Read
In my recent project, I delved into my reading habits using the Pocket app to analyze how frequently I engage with articles. By examining reading times, I uncovered key trends regarding my reading frequency and overall patterns that emerged over the years. Notably, graduate school significantly influenced my reading habits over the past 11 years, shaping both the quantity and quality of my article consumption. This exploration has provided valuable insights into my evolving relationship with reading.
05
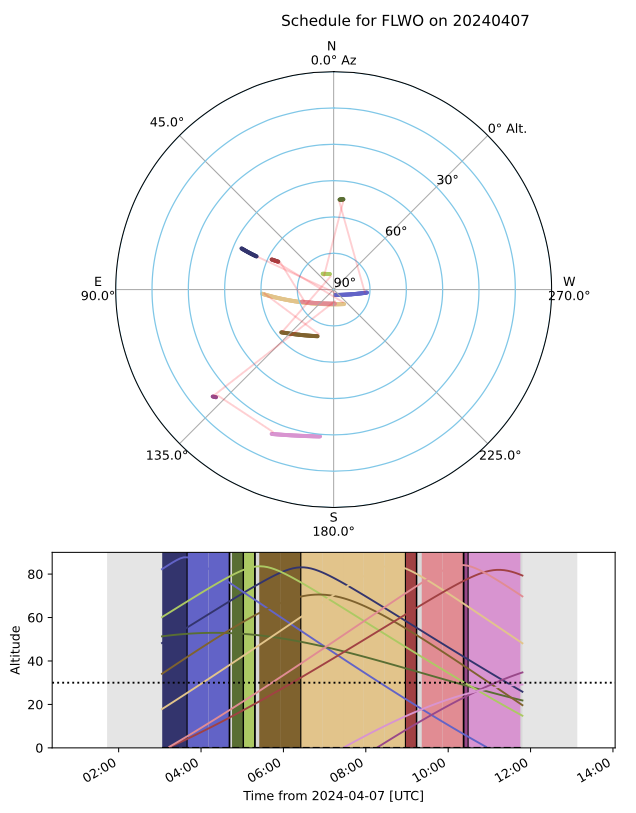
VTS Scheduler
I worked on a project aimed at developing an observation scheduler for VERITAS. This initiative addresses the intricacies of managing 30-minute observation runs, during which significant changes in the night sky can occur, while also balancing multiple competing science priorities. The scheduling challenge is intensified by the presence of pre-scheduled runs and the need to accommodate unforeseen astronomical events, such as supernovae. Our goal is to create a reliable scheduling framework that facilitates efficient parsing, editing, and recomputation, ultimately optimizing the utilization of observational time and resources.
06
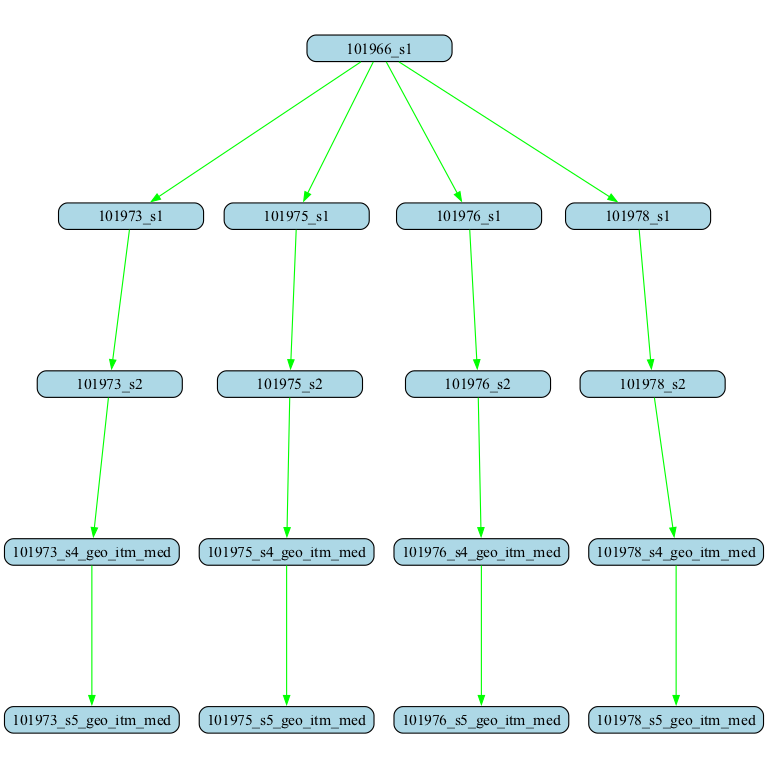
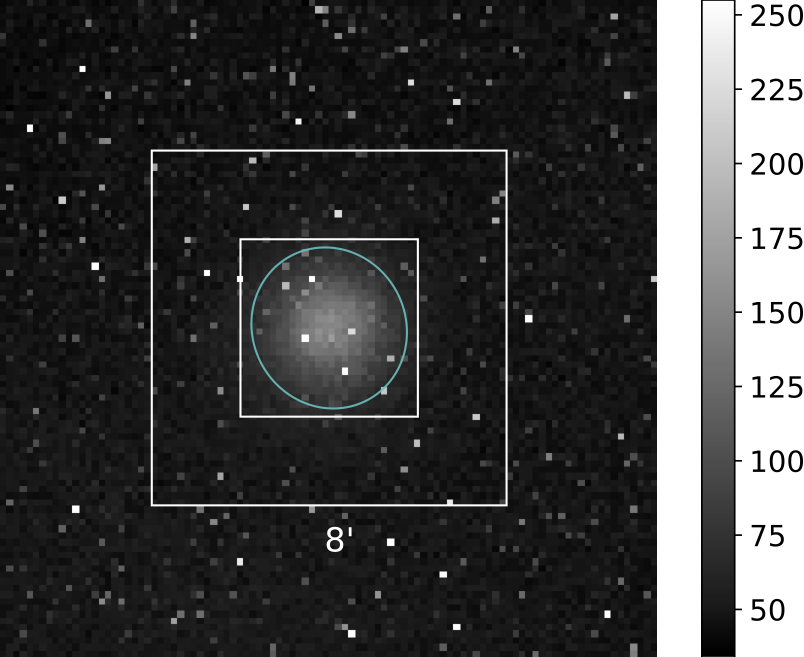
VERITAS Analysis Pipeline
I developed vegas_scripts, an automated data processing pipeline for the VERITAS gamma-ray observatory. This tool streamlines the complex multi-stage analysis workflow by automatically retrieving data from the VERITAS database, configuring the appropriate analysis parameters for each of the six processing stages, and submitting computation jobs to distributed computing clusters using Condor or Slurm. The system significantly improves efficiency by eliminating manual intervention in the data processing chain while ensuring consistent analysis parameters across large datasets.
07
SCT Mirror Alignment Visualizer
I developed a specialized visualization tool for tracking the alignment process of the Schwarzschild-Couder Telescope mirror panels. By parsing position, coordinate, and orientation data from actual panel measurements and edge sensors, the system translates complex alignment information into an intuitive 2D visualization. The color-coded representation reveals how individual mirror panels change position and orientation over time, providing invaluable insights for the telescope alignment team. This visual approach simplified the interpretation of technical alignment data and helped identify patterns that might otherwise remain hidden in numerical datasets.