I recently built a Retrieval-Augmented Generation (RAG) system for VERITAS, designed to query both the offline run database and the public VTS-catalog.This catalog, hosted on GitHub, lists all published VERITAS papers. The motivation was simple: VERITAS has an incredible history of observational data and publications, but accessing and querying this information is often clunky, fragmented, or locked in different formats. I wanted to unify this information into an interface where scientists could interact with it conversationally. The project began as a small experiment with Streamlit and text-to-SQL via Ollama, and quickly turned into an exploration of how far LLMs could actually go in helping scientists work with structured and unstructured data.
The first step was to create a Streamlit website that accepted natural language queries and translated them into SQL using Ollama. Setting up Ollama locally was more painful than expected, since managing models, memory constraints, and prompt design required a lot of trial and error. On my MacBook Air, with 8 GB of RAM, only Phi-3 ran reliably. Larger models like Mistral and LLaMA-3.1 were too resource-hungry. Everytime I ran it, the entire computer would freeze for several minutes. This highlighted the trade-offs that come with model selection: smaller models are efficient but limited, while larger models unlock more complex reasoning but require hardware I don’t have. One obvious upgrade is to deploy the project on the MSI cluster with GPU resources. Running the system live on powerful hardware would allow me to experiment with larger models, faster inference, and possibly real-time collaborative querying.
with st.spinner("Initializing RAG system..."):
    # Initialize RAG system
    st.session_state.rag_system = VERITAS_RAG(
        db_path=db_path,
        github_repo=github_repo,
        github_token=github_token if github_token else None,
    )
    # Track current model
    st.session_state.current_model = ollama_model
    ...

    if st.button("Ask Question", type="primary"):
    if question:
        with st.spinner("Generating SQL query and analyzing results..."):
            result = rag_system.query(question)
Snippet for streamlit to create the RAG system.
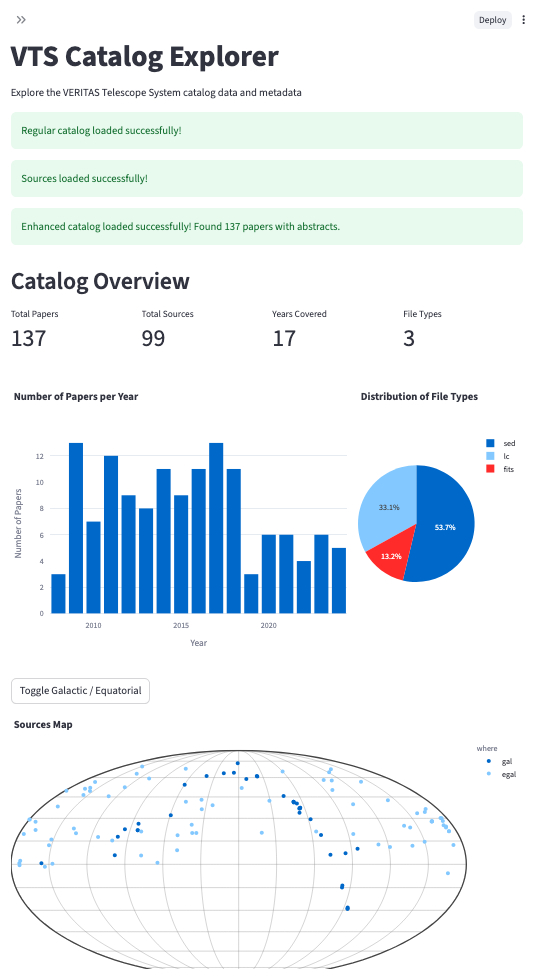
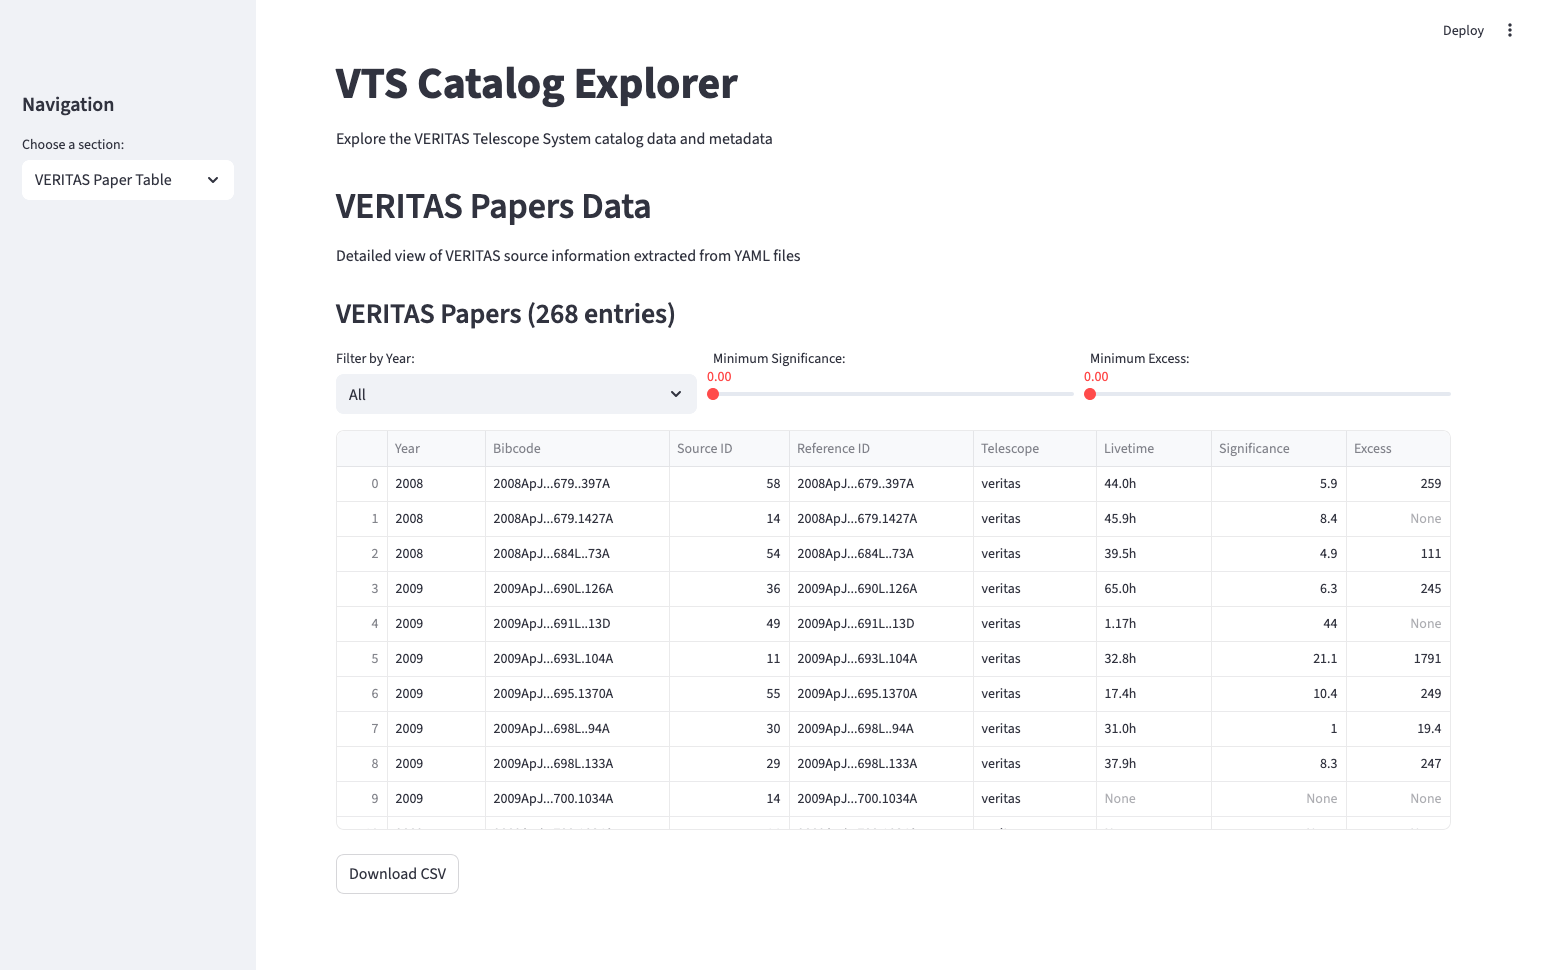

Since I didn’t want to risk breaking the real VERITAS run database during development, I created a local test DB and used it as a sandbox environment. Once the basic querying worked, I expanded into parsing the GitHub VTS-catalog. At first, I wrote a parser for the README.md, extracting sources manually into a dictionary. Later I discovered the SOURCES/ directory in the repo, which contained much richer metadata per object as YAML files. This opened the door to building a second Streamlit site: a catalog explorer that allowed browsing papers, figures, sources, bibcodes, and summary statistics.
def _extract_source_yaml_data(self, yaml_data):
    """Extract required fields from YAML data according to VERITAS catalog format."""
    extracted_data = {
        # Required fields from the specification
        'source_id': yaml_data.get('source_id'),
        'common_name': yaml_data.get('common_name'),
        'veritas_name': yaml_data.get('veritas_name'),
        'other_names': yaml_data.get('other_names', []),
        'where': yaml_data.get('where'),  # galactic (gal) or extragalactic (egal)
        'reference_id': yaml_data.get('reference_id', []),
    }

    # Extract position information
    if 'pos' in yaml_data:
        pos_section = yaml_data['pos']
        extracted_data.update({
            'simbad_id': pos_section.get('simbad_id'),
            'ra': pos_section.get('ra'),
            'dec': pos_section.get('dec')
        })

    # Handle special source_id categories
    source_id = extracted_data.get('source_id')
    if source_id:
        if source_id > 300000:
            extracted_data['observation_type'] = 'cosmic_ray'
        elif source_id > 100000:
            extracted_data['observation_type'] = 'non_detection'
        else:
            extracted_data['observation_type'] = 'detection'

    return extracted_data
Snippet for collecting ADS data
| Data Organization | Description |
|---|---|
| File Structure | Data files are organized by year and publication. |
| Reference Identifiers | ADS bibcodes are used to reference publications. |
| Object Identifiers | A running integer, labeled "source id," identifies objects. This scheme is based on the one used by gamma-cat. |
| Description Files | Found in the sources subdirectory, these files include the most relevant names for an object: common name, VERITAS object identifier, and primary SIMBAD identifier. |
| Object Coordinates | The description files also contain the object's coordinates. |
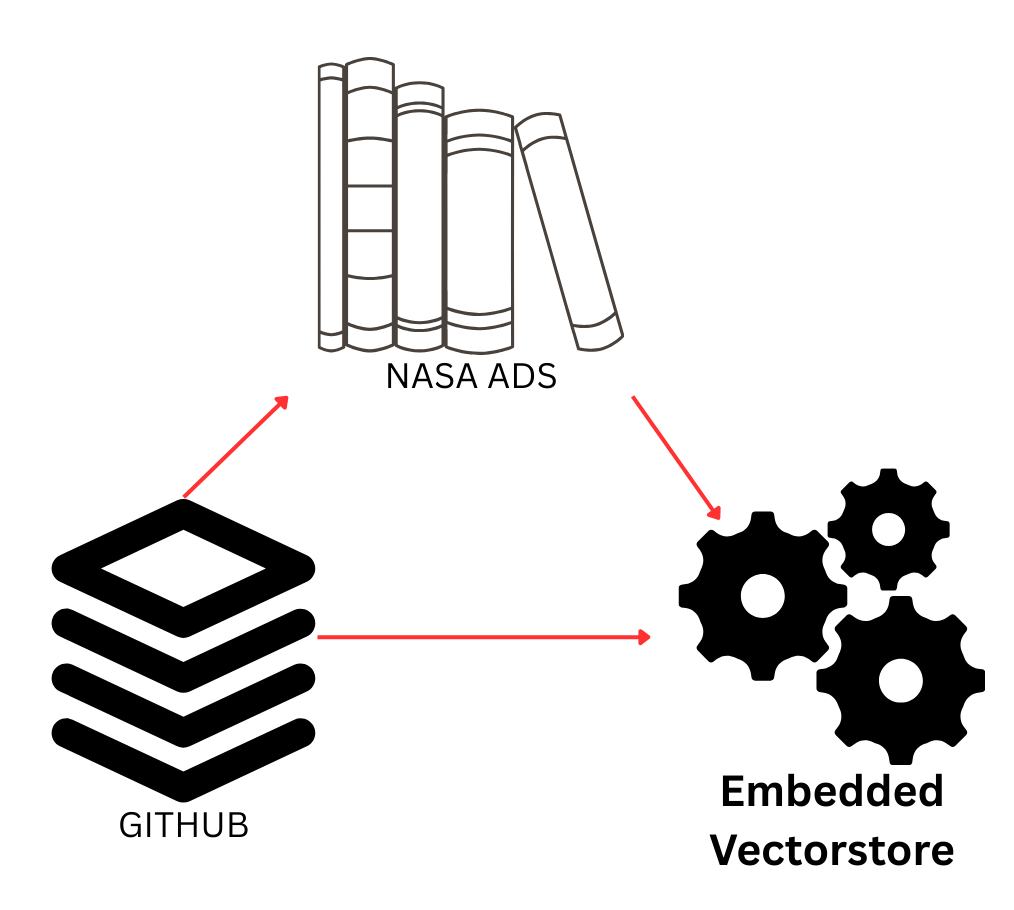
Diagram of how the catalog data is structured
One of the turning points was realizing I could link catalog bibcodes with NASA ADS. By creating an account and grabbing an API key, I could automatically fetch abstracts for every publication in the catalog. This meant the catalog explorer wasn’t just a static record anymore, and it became enriched with abstracts and metadata directly from ADS.
    try:
        papers = ads.SearchQuery(
            q=f'bibcode:"{bibcode}"',
            fl=['bibcode', 'title', 'abstract', 'author', 'year', 'pub', 'doi'],
            rows=1
        )
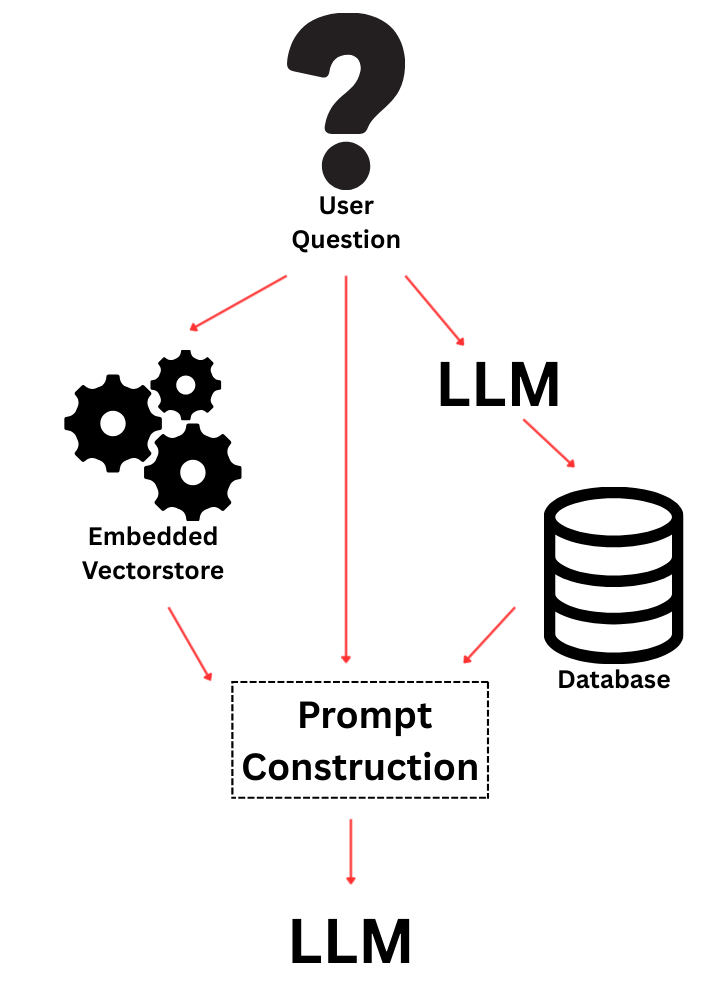
With abstracts in hand, I used LangChain to chunk the text into documents and build an embedding vectorstore. This part was relatively smooth: LangChain makes it straightforward to wrap text into Document objects, create embeddings, and query them efficiently. The final step was to merge SQL results with vectorstore retrieval into a unified prompt for the LLM. This was trickier than expected. Too much context and the model would stall or lose coherence; too little, and it would hallucinate. The balance lies in prompt engineering, which is really at the heart of making RAG systems usable.
try:
    print(f"Querying: {question}")

    result = self.qa_chain.invoke({"query": question})

    # Extract source information
    sources = []
    for doc in result.get("source_documents", []):
        # Convert comma-separated sources back to list for display
        sources_str = doc.metadata.get("sources", "")
        sources_list = (
            [s.strip() for s in sources_str.split(",") if s.strip()]
            if sources_str
            else []
        )
This is also where design issues became obvious. The system could answer questions like “which papers have analyzed data from source X?” or “show me the abstracts related to VERITAS detections of Y.” But users asked questions it couldn’t answer, such as “which runs were used in a specific paper?” That information is not tracked in any single database and is scattered across spreadsheets, wikis, or even email chains. Another question was “show me all runs within 2° of the Galactic Center.” This is perfectly computable, but it requires spherical geometry functions in SQL, something that is cumbersome to implement or requires specialized libraries, and not something an LLM reliably generates with text-to-SQL. These limitations show why RAG design isn’t just technical but also about expectation management. The interface, the wording of prompts, the page layout, and the guidance text must orient users to what the system can do, while making its boundaries clear. Otherwise, you risk frustration and misplaced trust.


Why did I build this in the first place? I really wanted to explore AI products beyond just chatbots. I learned about the various business use cases, starting with prompt engineering, then RAGs, then SQL-RAGs, and finally agents. With the various data sets I had available, I started to think through ways that users could merge them into complex queries and how natural language would be the best way. I also thought about privacy concerns, making sure that I could run things locally without exposing the VERITAS database to ChatGPT. From these constraints, what emerged was that I could play with a local LLM, build my first RAG, create a useful tool for the collaboration, and learn a few new libraries along the way. Many of these outputs were goals of mine in my current educational trajectory.
The idea to merge VTS-Cat and the observation database into a RAG came right away. Those were two datasets that were very naturally related, and many questions by my colleagues start there. I didn’t really need to brainstorm further since it immediately felt like a very rich product. I could easily imagine the service it would provide to VERITAS workflows.
The technical stack also shaped the project. To begin with, I wanted to work locally to ensure there was no exposure of our private data to online services - that would be highly inappropriate for our work. This meant I needed ollama on my M2 macbook, which also narrowed which models I could use. Once I started playing with the LLM, I learned that I was limited to models with 3B or fewer parameters, which effectively reduced it to phi3 and limited the kinds of text-to-SQL output it would generate. I couldn’t use a dedicated SQL LLM since that was 7B, too big for my system.
The size of this model also impacted the size of the engineered prompt. As I built the SQL generator, I kept adding rules to help it create better queries (to avoid typos, mis-attributing fields to tables, etc.), eventually reaching 17 rules. It became clear this was too far, and I need to pare down to a handful of core rules. I also needed to implement a second query that would fix the first SQL query in case that result yielded nonsense.
For the embedding model, I used the vanilla langchain with ‘all-MiniLM-L6-v2’, phi3 LLM, and default chunksize of 1000 with overlap of 200. No issues with these since I had just a small catalog of paper abstracts. One routine that I thought through but discarded: maybe I could generate strings based on the metadata (like paper year, title, sources involved, etc.) I discarded this idea since I felt these constructed strings could clutter the embedding vectorstore with similar strings that only differed by the numbers inside them, forcing the LLM to understand the numbers (unlikely) or creating vectors that would be extremely similar in the latent space.
Looking forward, there are many possible directions. Ultimately, I’d like to deploy on a system with a higher end GPU and enough memory. The MSI cluster is accessible for me but not possible for exposing to the outside (for other collaborators). This is probably ok in the short run since I don’t envision anyone at VERITAS intending to support it further, and I would mostly share with MSI users or myself (for fun!). There are a couple of minimum steps remaining: 1) rework the DB connection to use the real DBs and their tables, making sure to keep alive one connection to avoid getting automatically blacklisted. 2) Hide the DB credentials. 3) Further rework the engineered prompts, especially the format and length of the final answer. 4) Update the visualization to include the VERITAS logo and color scheme. 5) Update the example queries and word choice within the UI/UX to temper the expectations and guide the user.
Finally, there’s the broader perspective. This is a classic text-to-SQL + RAG, where the LLM helps query the DB, and a separate collection of text further augments the prompt (via abstracts from the catalog). It creates a system where users can ask about what we observed and when, and if we had more tools, it could do fairly complicated querying of that database. This tool helps users plan their observation proposals, think about what VERITAS has observed and published, and systematically explore the VERITAS data legacy. It is a rudimentary tool, a first step toward an interface that effectively personalizes the observatory. A vision emerges: this is a conversation with an observatory elder and insider - a robot version of Trevor Weekes, with live access to current observations. Other observatories have their elders (like Frances Halzen for IceCube or Kip Thorne for LIGO), and we can build these specialized personifications of them for operators to work with.
Building this RAG system for VERITAS was as much a lesson in system design as it was in LLMs and embeddings. The technical path—from setting up Ollama locally, building Streamlit interfaces, parsing the VTS-catalog, linking with NASA ADS, and embedding documents with LangChain—was straightforward in parts and painfully finicky in others. But the real challenge lies in managing user expectations and defining clear boundaries on what a scientific RAG can and cannot do. The result is a living system that brings together structured and unstructured data, offering a new way to interact with VERITAS research. It is not perfect, but it shows the direction these tools can take us if we carefully design them for both technical performance and human usability.