When my baby was born, I quickly realized I needed a way to keep track of feeding schedules to know what was next. Most of the apps I found were cloud-based and pushed data through third-party services. I wanted something simple and private. It also need to be reliable and have enough features to capture the full picture. I needed to share the data with my family and caretakers.
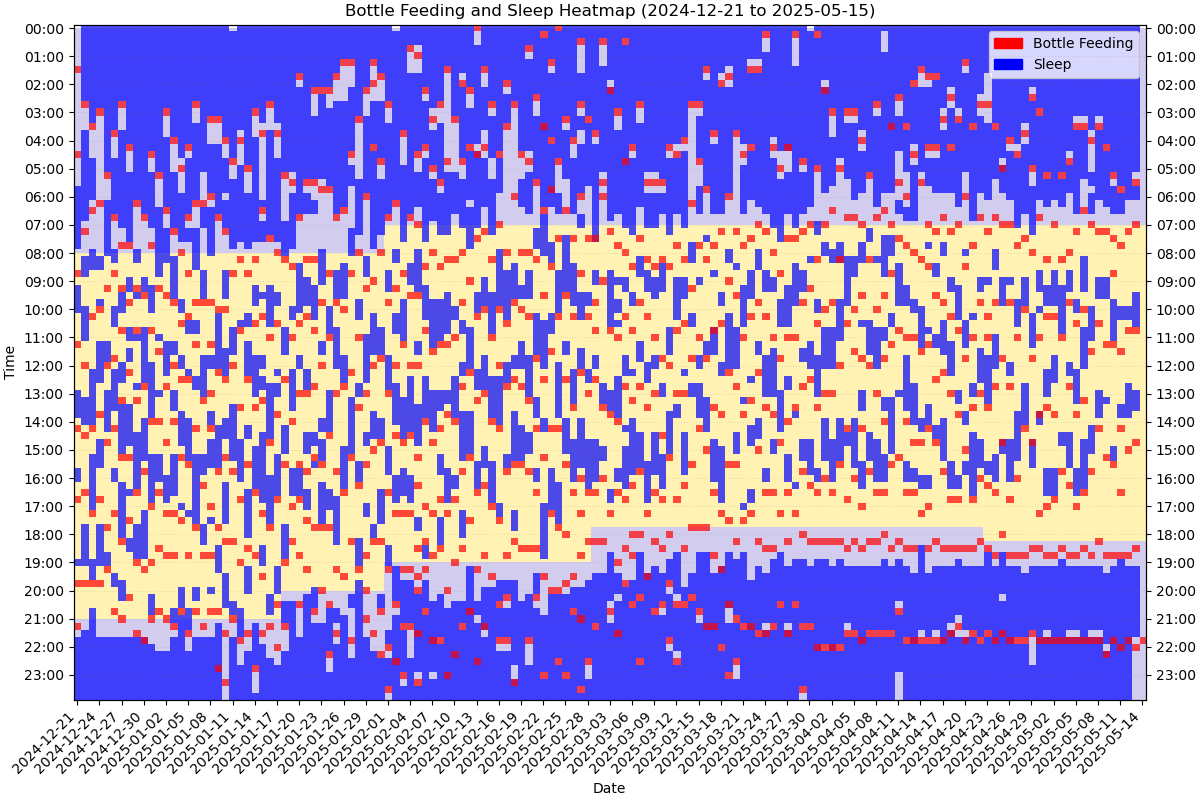
At first, I only wanted a checklist of bottles and naps. But it became clear that if I could collect the data over weeks and months, I might be able to see trends that aren’t obvious, like whether naps were shifting earlier, or whether bottle amounts were ramping up during a growth spurt. I was really intrigued by the many heat map of naps regularly posted on reddit, showing order evolving from chaos as the baby grew.
After a long search, I discovered the MyBaby app. It stored all the data locally (in an accessible directory in my icloud folder), which meant there was hope of extracting it.
With help from a JavaScript expert, I wrote a small script that could read the app’s database and export everything to JSON. From there, I built a toolchain that let me import the data directly into Pandas as a dataframe. Finally, I had a fully analyzable dataset of bottles, naps, diapers, and growth milestones.
Once I had the data, I wanted to make it useful for everyone involved in daily care. I created a simple nightly update: a chat thread that pulled the latest results so my family could see what had happened that day. Everyone could check the thread and instantly know the last feeding, nap, or diaper without needing to ask. It kept things consistent even when multiple people were helping.
From there, things escalated into a full data science project. I built a Jupyter notebook to generate clean visualizations. I grouped everything into six categories:
- Bottles (amount and timing)
- Sleeping (start times and durations)
- Growth (weight, height, head circumference)
- Diaper changes (wet vs. dirty)
- Baby gas drops (medicine tracking)
- Meals (food groups)


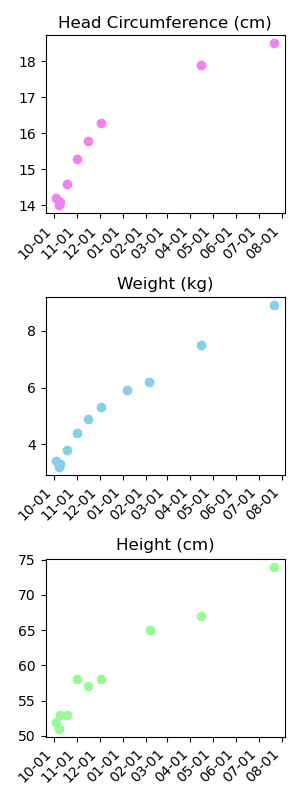
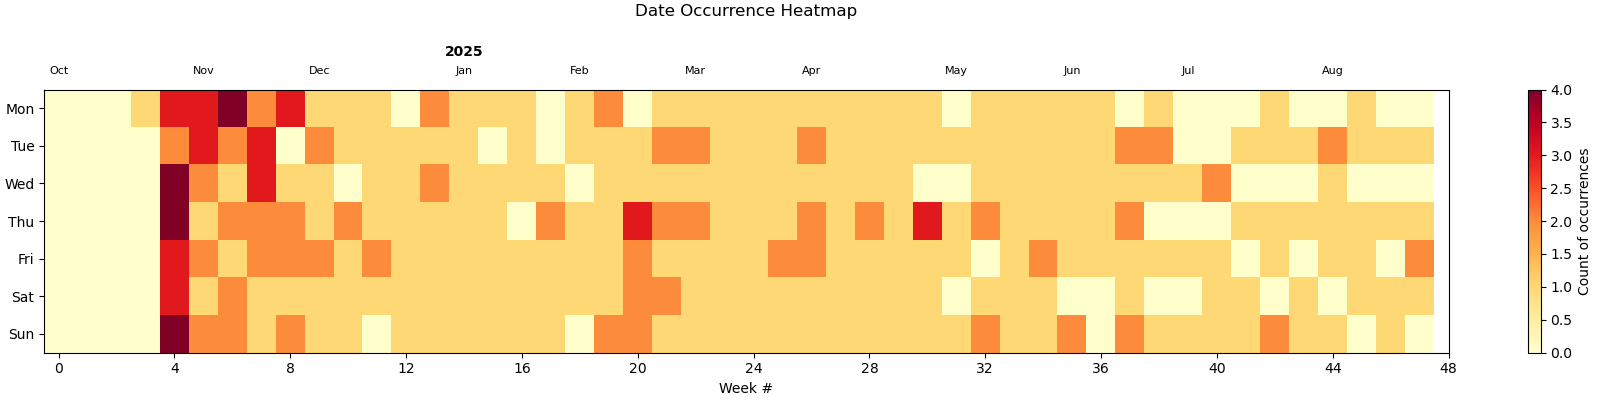
The results were surprisingly fun. Bottles showed a clear upward trend, naps gradually consolidated, and diaper counts followed predictable daily rhythms. I even spotted a few anomalies, like a sudden drop in diaper changes that lined up perfectly with a change in formula.
To share the highlights, I put together a PowerPoint presentation for the family (complete with a tongue-in-cheek “written by” credit to our rabbit). It became a running joke, but also a way to show how structured data can transform everyday chaos into something that actually makes sense.
Looking back, I learned more than just how to wrangle baby logs into Pandas. I saw firsthand how small-scale data science can reveal order in noisy, personal experiences. What feels random day to day often follows consistent patterns—whether it’s bottles, naps, or diapers. And once you can see those patterns, you can relax a little, knowing what’s normal and what’s not.